Race, R, and Richmond's new mayor

Something unusual happened in the 2016 Richmond mayoral election that doesn’t fit neatly with our municipal self-story about how our racial politics work. I wrote an election wrap-up for Style Weekly that tells you quite a bit about how Levar Stoney won the mayoral race, but this one particular unusual thing fell out of scope of that because it requires a very small statistics primer to make sense.
Don’t worry, this is easy stuff, and it’ll help you understand a lot of things beyond what we’re talking about today.
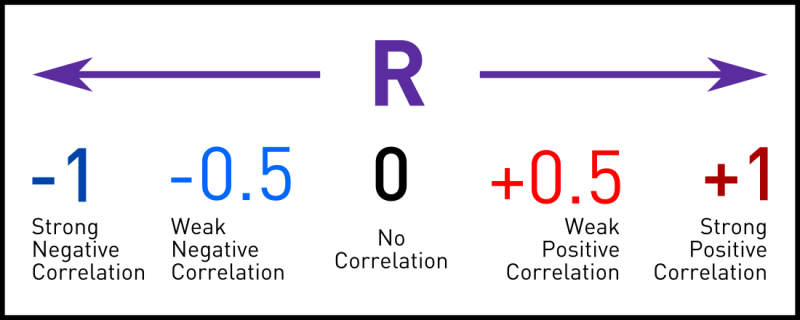
There’s a number statistics nerds call R which, in a nutshell, helps you figure out whether or not two things are correlated to one another, and if so, how strongly1. It’s not the whole story, as totally nonsense things can be strongly correlated to one another, but it gives you an idea of what to examine more closely.
R always falls between -1 and +1, because there are two different kinds of relationships that are possible when numbers are correlated: positive, where more of Thing A means more of Thing B, and negative, where more of Thing A means less of Thing B.
The closer to +1 or -1 the R is, the stronger the correlation; the closer to 0 it is, the weaker it is:

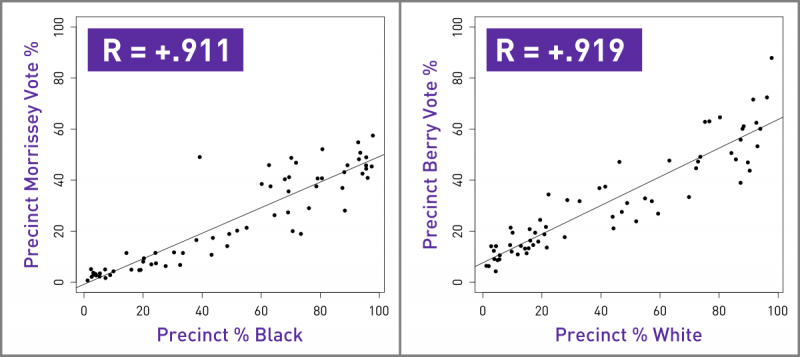
Now that you know what an R can tell you, here’s some real-world information: the vote share by precinct for two of Richmond’s 2016 mayoral candidates, Jack Berry and Joe Morrissey, was strongly positively correlated with the racial makeup of the precinct:
Precinct Morrissey Vote % : Precinct % Black :: R = +0.911
Precinct Berry Vote % : Precinct % White :: R = +0.919
The relationship for those two candidates was so strong that if you knew nothing about a precinct but the percentage of its residents that are white and the percentage that are black, you would be able to reasonably guess the Berry and Morrissey vote percentage at that precinct with simple equations:
Precinct Morrissey Vote % ≈ 0.507(Precinct % Black) – 0.007
Precinct Berry Vote % ≈ 0.5613(Precinct % White) + 0.0764
That sounds like a really strong relationship, but we still need to look at the actual numbers on a plot to see if that’s real or not online task manager. If the correlation is actually strong, we should see the points clumped pretty tightly around the regression line. For these two cases, they definitely are:

These results would seem to support the narrative of a racially Balkanized Richmond, where voters come in neat ethnic blocs. But neither of these candidates who performed mostly in line with racial groups won the mayoral election.
Levar Stoney did.
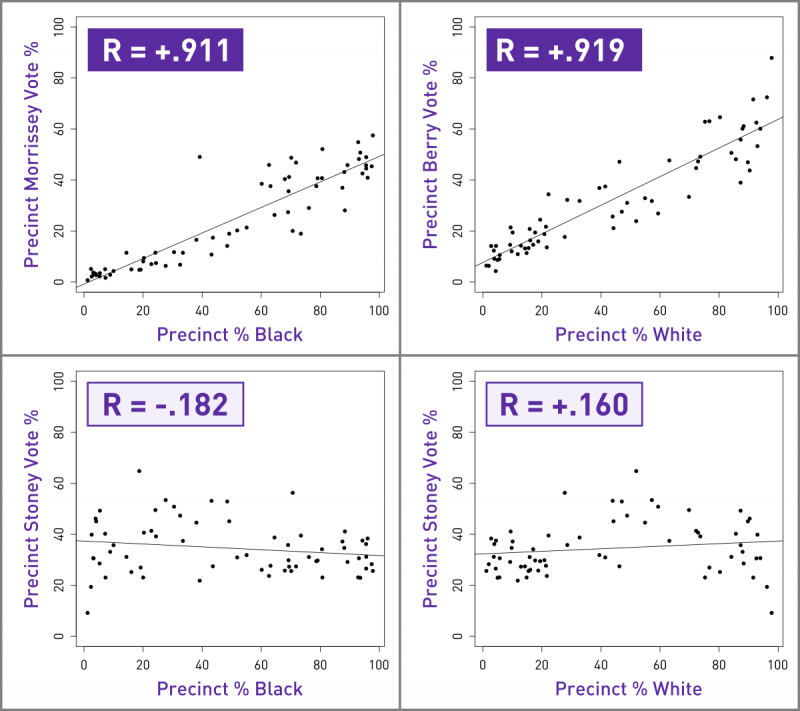
Let’s compare those same R values we dissected above with the comparables for the winning candidate:
Precinct Morrissey Vote % : Precinct % Black :: R = +0.911
Precinct Stoney Vote % : Precinct % Black :: R = -0.182
Precinct Berry Vote % : Precinct % White :: R = +0.919
Precinct Stoney Vote % : Precinct % White :: R = +0.160
Those numbers should absolutely leap out at you by this point: there was almost no correlation between the percentage of a precinct’s votes that went to Levar Stoney and that precinct’s racial makeup. Compare the plots:

So unlike for 2nd place finisher Jack Berry or 3rd place Joe Morrissey, you can’t write a simple linear equation to predict Stoney’s vote share based on race. Those two variables just weren’t related in any meaningful way.
Don’t mistake this for a Pollyanna proclamation of post-racialism. But it is significant that mayor-elect Stoney earned his new office with broad biracial support when the other top contenders earned most of their votes from single racial groups.
That’s your statistics lesson for now, but R—”Pearson correlation” if you’re nasty—is everywhere in the world around you.
Now that you know a bit about it, you’ll be able to easily pick out figures in my election wrap-up that are based on R and other numbers that measure “goodness of fit” (yes, this is a real statistical term).
- We're just talking about linear regression today, which is just one kind, but you have to start somewhere, right? Also, this is a Pearson correlation. ↩