CNU's Richmond mayoral poll doesn't tell us much about district-level preferences
Because polling for local elections is both notoriously challenging and expensive, the newly released public poll of voter preferences in the Richmond 2016 mayoral election from the Watson Center at Christopher Newport University is both the first, and likely the last, public poll Richmonders have to go on in gauging how the city will vote.
The citywide results of the poll of 600 respondents has an adjusted margin of error of ±4.9%, but the margins for the individual districts are much, much higher — ranging from ±13.1% to ±16.3%. And those numbers matter, because the successful candidate will need to win a plurality in 5 of 9 council districts to be seated.
What gives here? What is a margin of error? And why does this mean it is very unlikely that Bruce Tyler will capture 11% of the vote in Michelle Mosby’s Southside 9th District?
Like most matters in statistics, margin of error makes the most sense when you just put it into a sentence:
A poll result of 50% with a ±5% Margin of Error means we can say, at the chosen confidence level, that the “true result” lies somewhere between 50 minus 5, or 45%, and 50 plus 5, or 55%.
Or hey, let’s make it even simpler:
±5% Margin of Error tells us that the “true result” is somewhere in a 10% spread around the reported result from the sample.
Not too bad, right? It’s not bad to have a large margin of error, but it’s really important to be aware of it when you’re trying to make sense of a statistic. A large margin of error can result from a lot of different factors, but in this case, it’s the most common bogeyman of all: small sample size. CNU just didn’t make contact with enough voters in every one of the city’s nine council districts to be confident that the sample they wound up with was particularly representative of the population in each council district. That shows up in the results as a large margin of error.
Let’s put a particular result into a narrative sentence again to explain it:
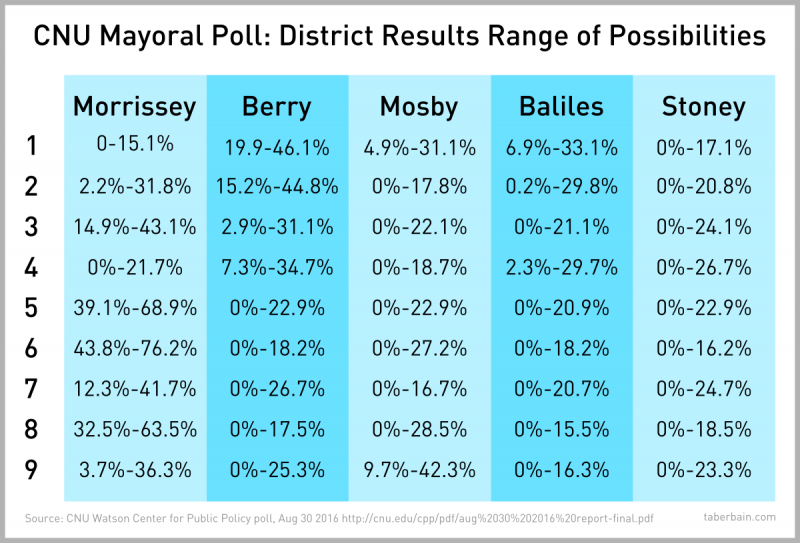
In Richmond’s 3rd Council District, 29% of respondents to our poll gave Joe Morrissey as their first choice for mayor, with a margin of error of ±14.1%. This means we can say with 95% confidence that, if we could somehow have spoken to to every registered voter in Richmond’s 3rd Council District, somewhere between 14.9% (29-14.1) and 43.1% (29+14.1) of them would give Joe Morrissey as their first choice for mayor.
You can fill in the blanks of that sentence with the results for these leading candidates, reflecting the full range of possibilities given by the district-level margins of error, and see just how massive a ±13.1% (26.2% spread) to ±16.3% (32.6% spread) margin of error really is:

That doesn’t mean you can’t tell anything from the district-level results, of course. Overall poll leader Joe Morrissey (citywide 28% ±4.9%) has a higher floor and higher ceiling of registered voters who would be likely to make him their first choice in a larger number of districts than any other candidate. This is expected, and there’s some interesting variation here that’s worth considering.
These margins are so big though because the pollsters can’t be very confident they got a representative sample from the very small number of voters contacted in each of the nine council districts. Of the 600 respondents polled, if an equal number had been from each district, that would be just 67 voters to represent an entire council district of roughly 25,000 people. That means larger margin of error.
With 69 days to go, it’s still very early season for local elections, and especially here in Richmond. Current poll leader Morrissey is a household name throughout the city and across all social and economic groups, and in a race few are truly tuned into or engaged with, a preference poll tends to exaggerate support for the known.
But the results from individual districts in CNU’s poll are just too noisy to tell us a lot we, or the campaigns, don’t already know. Interpret them loosely and with extreme caution.